Schools
Three Albany Schools Improve, Two Slip in State Performance Measure
Cornell and Ocean View scores dropped slightly from 2009, but still are well above the state target. A full report on scores will be given to the Board of Education on Sept. 21. See PDF reports on each school here.


The California Department of Education released scores Monday that continue to show Albany schools well above the state target for academic performance, though numbers also highlight areas for improvement.
The Academic Performance Index Report, which is based on test scores from the prior year and has a range from 200 to 1000, showed that scores for white students throughout the district fell by eight points in 2009-10, and those for some other groups remained relatively flat.
Hispanic and black students showed the largest improvements, followed by English learners, though these groups still score below white and Asian students.
Find out what's happening in Albanywith free, real-time updates from Patch.
The district-wide index score increased from 864 to 871, compared with county and state averages of 788 and 767. The statewide average increase was nearly twice as high, at 13 points.
The score was based on tests taken by 2,737 students. (Reported enrollment in the Albany Unified School District for 2009-10 was 2,860 students.)
Find out what's happening in Albanywith free, real-time updates from Patch.
California has set 800 as the API target for all schools in the state. In 2010, 46 percent of all schools succeeded in meeting this goal.
Monday's release included the Annual Yearly Progress Report, which is required by the federal government, and indicates whether schools are improving academically each year.
In addition to improving their test scores, as shown in the API, Marin Elementary and Albany High met their target AYP improvement rates. At Marin, of 324 students tested, English language learners and white students showed double digit growth. At the high school, of 875 students tested, Asian and Hispanic children did the same; the average for English learners improved by the largest margin, 57 points.
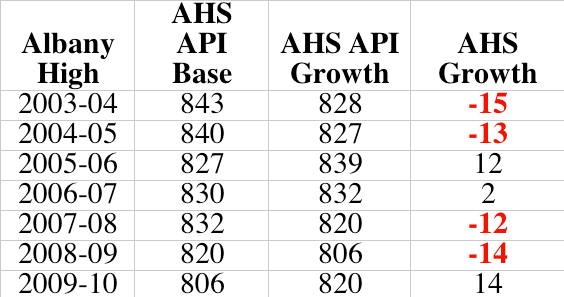
The high school managed to grow its API score for the first time in three years, but the score remains at nearly its lowest level in the past seven years.
Albany Middle School's API score improved, to 889, but it did not make its AYP progress goal because not enough students in three subgroups (socioeconomically disadvantaged, students with disabilities or English learners) tested at proficient levels in English-language arts or mathematics. Of 841 students tested, the score for white students dropped 27 points. Socioeconomically disadvantaged students showed the strongest growth, with an 18 point boost.
(API scores are reported for overall student bodies, as well as 11 different subgroups, which include a range of ethnicities and several other categories, including socioeconomic status, English language ability and disabilities.)
The average API score for 344 Cornell and 323 Ocean View students dropped slightly, 11 points and four points, but both schools still scored high, at 901 and 917 respectively. At Cornell, scores for all numerically significant subgroups fell, most sharply for Asian students. The same trend was true at Ocean View.
Most schools must have at least 100 students in a subgroup for it to be considered numerically significant.
Though the district performs well compared with county and statewide averages, compared with similar schools, most of Albany's schools fall short, according to the most recent data available. Last fall, Albany High School had practically the lowest API score in a list of about 100 "similar schools," 806 compared with 949. (See the attached PDF for the complete list.) Cornell and Marin elementary schools, along with the middle school, were in the lowest quarter of similar schools. Ocean View Elementary, on the other hand, was in the upper third.
A full report on scores will be given to the Board of Education on Sept. 21.
WHAT DOES IT MEAN?
Here are some helpful definitions about test scores.
- Annual Performance Index (API): This is a number, from 200 to 1000, that shows how well California students performed on standardized tests and how much schools are improving year to year. API reports indicate whether schools meet state achievement requirements. Student scores are weighted, so improvements for lower-achieving students are effectively worth more than improvements by those at the top.
- Annual Yearly Progress (AYP): This number, which is required by the federal government, indicates how well schools are meeting four sets of requirements: student participation on statewide tests; percentage of students scoring at or above the proficient level in English and math; API growth; and graduation rate (for high schools).
- Key differences between API and AYI: API is an index model that measures improvement from one year to the next; schools get credit for improving the overall performance of their students. Growth targets are set based upon the starting point of the school and are re-set each year depending on the level of growth. The federal AYP system rewards schools for the percent of students scoring at or above the proficient level on state assessments. All schools are expected to meet the same target at the same time.
- Want to know more? Click here for information on terms, calculations, overviews and other aspects of the Annual Performance Review system. You can also crunch numbers to your heart's delight at the California Department of Education's DataQuest.
- Click the images and PDFs attached to this story for even more information. There are PDFs for each school, historical data about the school district, and more detailed breakdowns about subgroups at the high school.